
Our group decided to focus on waste data, and used Miro as a shared research space from pretty early on. Everyone drops what they find, and we figure out the shape of the project together through comments and meetings. In practice, it was a lot messier than that — in a good way!! I thought that the way my group all collaborated on research and engaged with each other’s sources was really nice!
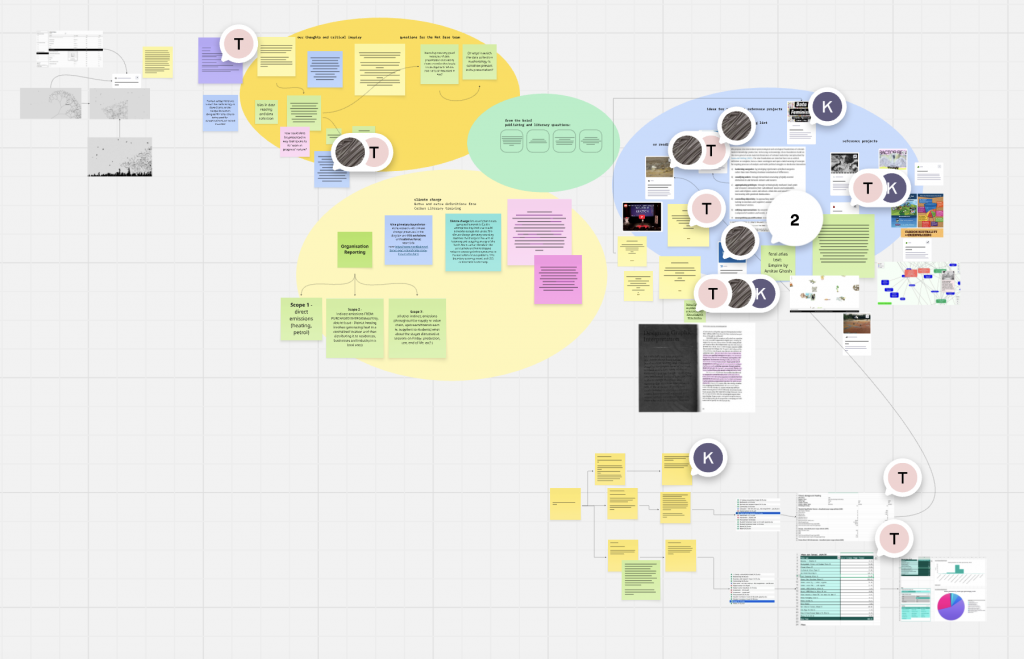
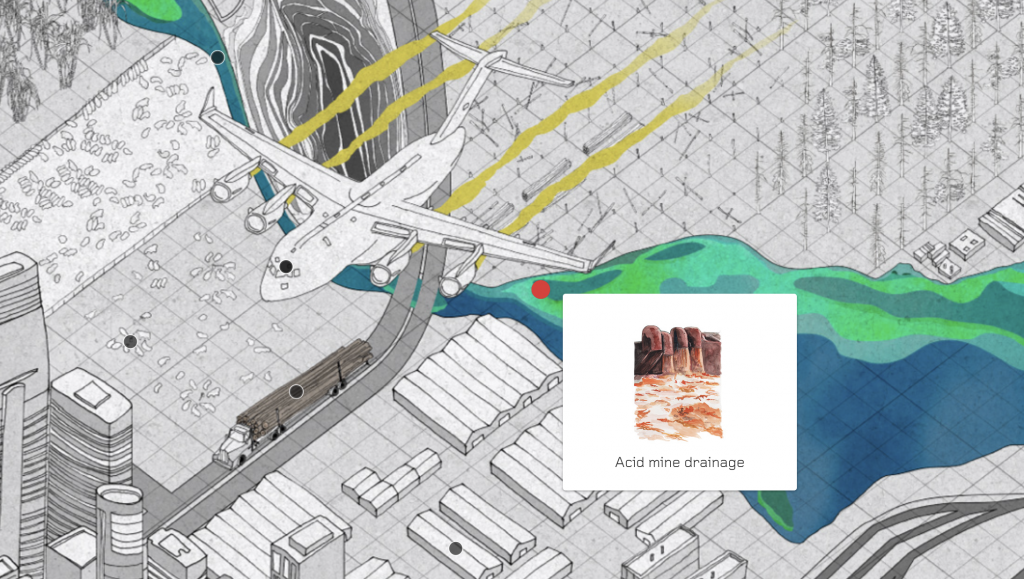
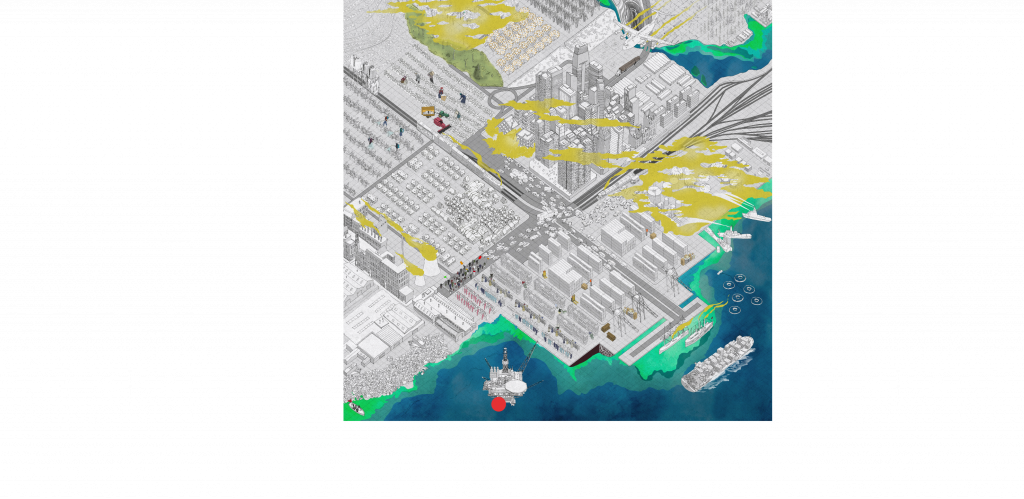
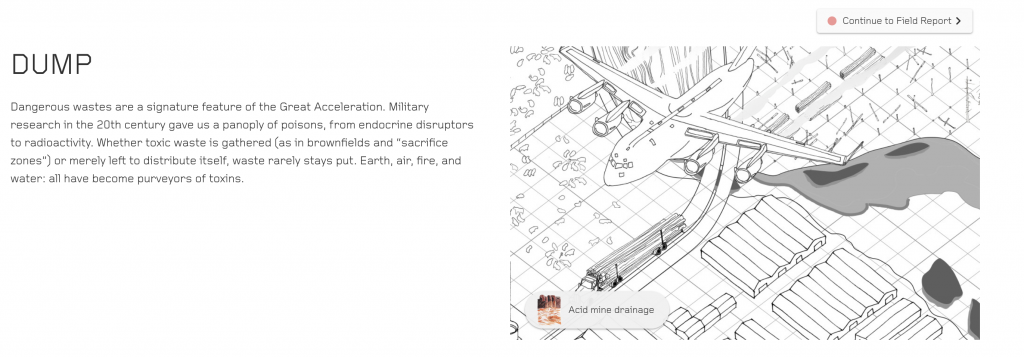
it was established pretty early on that everyone in the group was very inspired by the feral atlas. (https://feralatlas.supdigital.org/) We kept coming back to it as a reference — the way it maps these unexpected chains of connection between human infrastructure and ecological fallout. It felt like exactly what we were trying to do: take one line in a spreadsheet and pull on it until you could see the whole web.
engaging with UAL’s waste data was a little bit overwhelming as there are so many entries and everything looks the same and i have a fear of numbers, but something interesting i found was that 24 out of 27 E-waste entries all look exactly the same… every entry weighs exactly 0.050 tonnes (which makes me think it is the bin’s weight perhaps??) and the trail of what happens to the waste (which at this point is a metaphorical blob bcos there is no material breakdown) disappears after it is logged as being sent to Suez Sittingbourne Transfer Station.

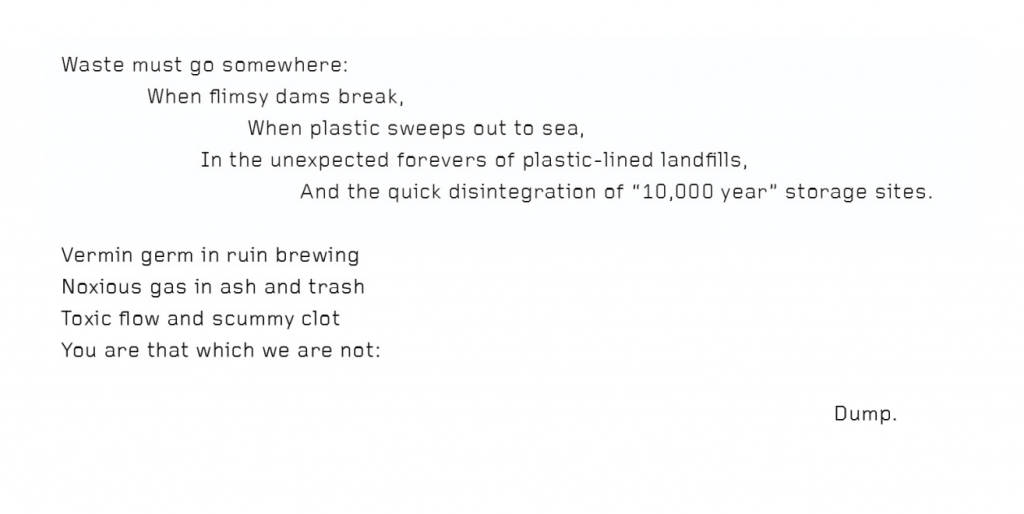
this inspired the thread of enquiry that i found myself with: what are the ‘feral consequences’ of UAL’s waste?
when finding actual data as part of my research, i found a holy grail source that i extracted most of my data from……
UN Global E-Waste Monitor 2024!
https://ewastemonitor.info/wp-content/uploads/2024/03/GEM_2024_18-03_web_page_per_page_web.pdf
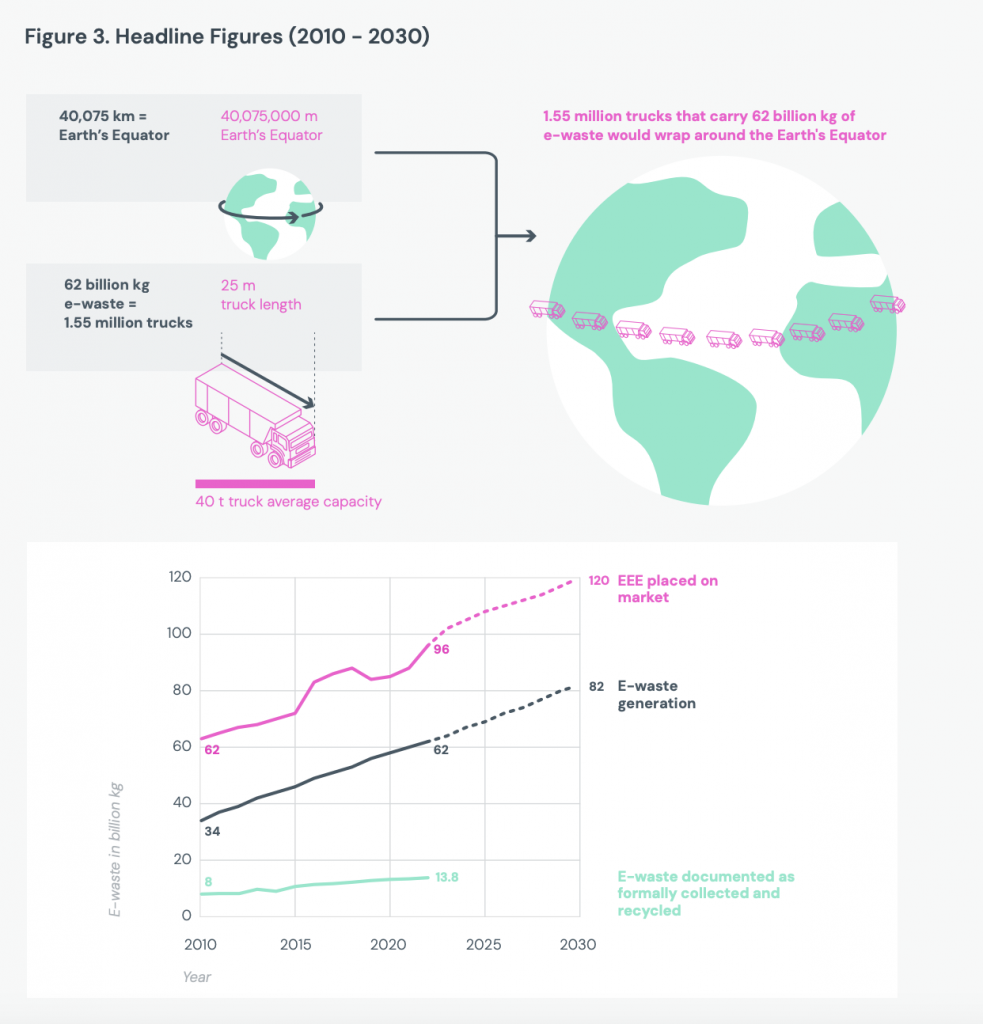
it deserves its own section! it sounds quite boring and i was lazy to read more data and figures, but i was pleasantly surprised by how engaging and easy of a read this was. Published by UNITAR and the ITU, it is an enormous, meticulously researched report on the state of e-waste globally — and it became basically the data backbone of almost all our work.
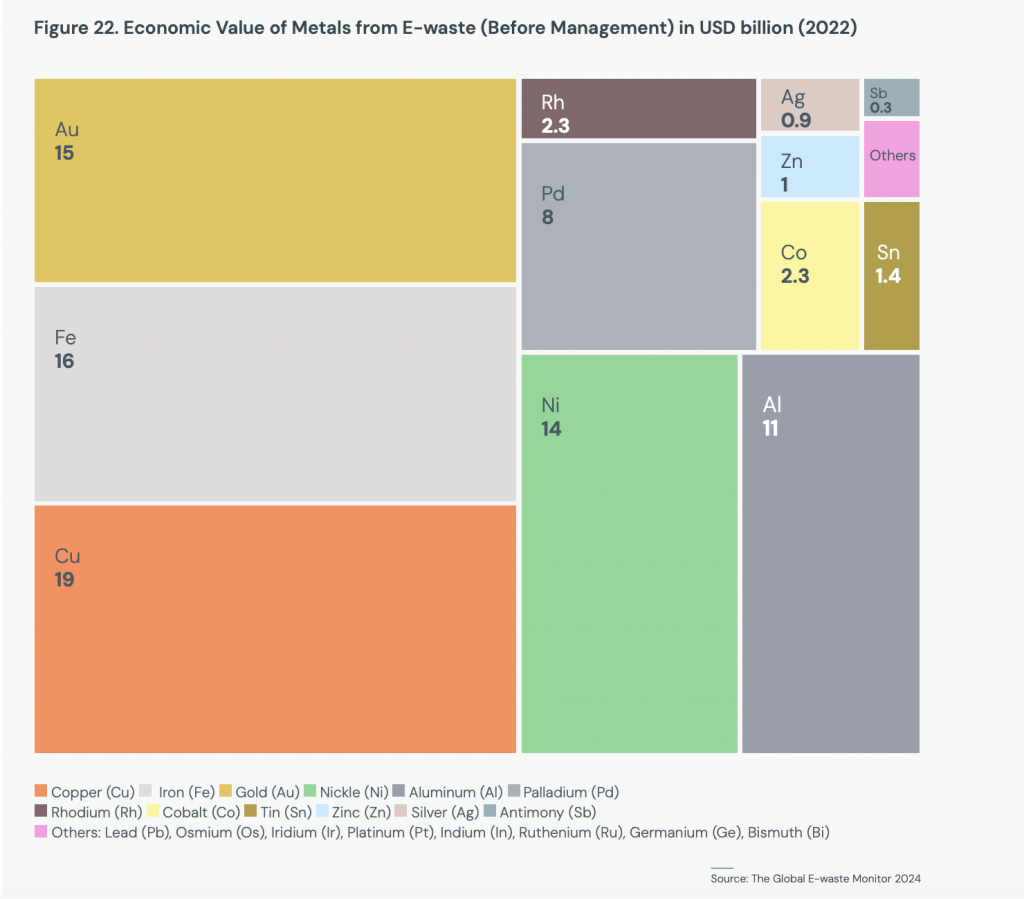
Every time I needed a number, it was in there. The 22.3% global formal recycling rate… The 77.6% of e-waste whose destination is completely undocumented… The material composition breakdowns that let us estimate what was actually inside UAL’s 0.050 tonnes… gold, the copper, the palladium, the brominated flame retardants… The transboundary movement data that showed how waste flows from institutions like ours into informal processing sites in places like Agbogbloshie.
I kept going back to it throughout the whole project and the numbers are what informs the final receipt!
Leave a Reply